
While working at my current workplace, the opportunity arose to design a proof-of-concept for a system that effectively identifies potential anomalies within the production cycle. By leveraging the expertise of the shop floor employees and utilizing machine learning techniques, the objective was to create a system that seamlessly integrates with the existing factory infrastructure.
The factory specializes in the manufacturing of staircases and there was a desire to implement a decision support system that proactively alerts our CNC operators regarding issues with their current workpiece. In my role as an aspiring data scientist, I was more than happy to address this need by developing an anomaly detection system that enhances the factory’s operational efficiency.
In collaboration with the experienced shop floor employees, who possess domain knowledge accumulated over their extensive tenure at the production site, we identified key indicators of anomalies: temperature, humidity, and sound volume. These factors were determined to be reliable indicators of potential anomalies within the production cycle, including the presence of faulty items.
By proactively identifying potential issues within the production cycle, the system would enable timely interventions, leading to enhanced productivity, reduced downtime, and improved product quality. In the subsequent sections of this project report will delve into the details of the approach, methodology, and specific techniques employed to develop and implement the anomaly detection system.
System Overview
We will, first of all, discuss the general implementation procedure of the project and how the components of the whole system fit together. So, the overall anomaly detection package consists of two working parts. The first component is a Python script that contains a class for simulating the generation of three distinct sensor readings, as there were no sensors mounted during the development of this proof-of-concept. The virtual sensor readings are temperature, humidity, and volume which are generated at a frequency of two hertz and are sent via HTTP requests.
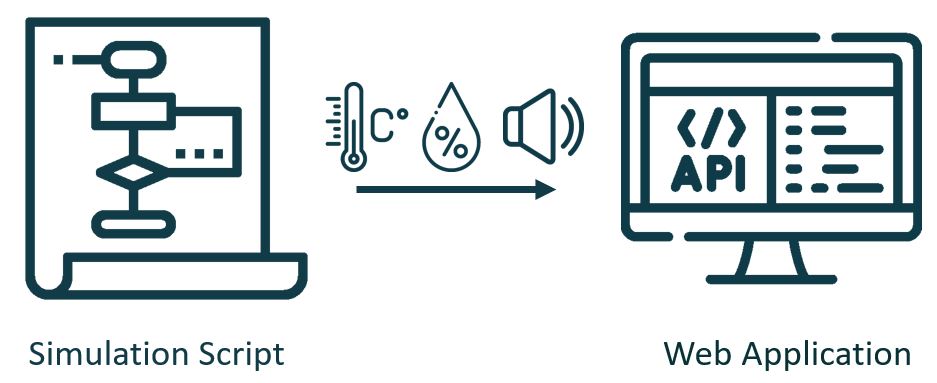
On the receiving end and as the second component we have a web application based on Django. The web application features a REST-API endpoint for receiving the virtual sensor data, a machine learning model for predicting anomalies, an administration interface for authenticating simulated machines, and a SQL database for storing logged data.
Implementation Procedure
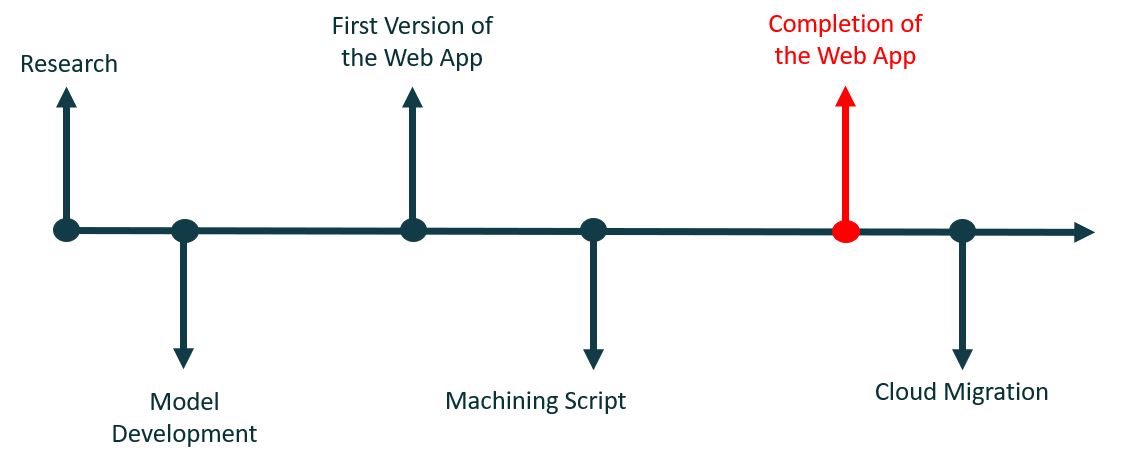
In the case of this project, the first step was centered around the core of the whole system, which is the machine learning model. To get a working model it was necessary to research the necessary techniques for the anomaly detection use case. Thereby the model was first trained with self-generated data and then serialized for later usage in the web application.
After the creation of a usable model, the first version of the web application was developed. This first version included the API endpoint for receiving data and the administration interface for registering machines. To complement the web application, the next step was to write the script for generating sensor data.
In the final step, the web application was then finished by complementing the data logging functionality and migrated to the cloud.
Training Data Characteristics
An anomaly can be described as a data point with characteristics diverging from the data considered normal. For the use case of this project, we can make the assumption that our sensor readings follow a Gaussian distribution, as sensor readings normally do. To train the model a dataset with thousand sensor readings for temperature, humidity, and volume was generated. So we have a thousand data points for temperature with a mean of 25° Celsius and a standard deviation of 5° Celsius. For humidity, we have a thousand readings with 60% as the mean and 5% percent as the standard deviation. And finally, we have a thousand readings for volume with a mean of 100 decibels and a standard deviation of 10 decibels.
Model Selection
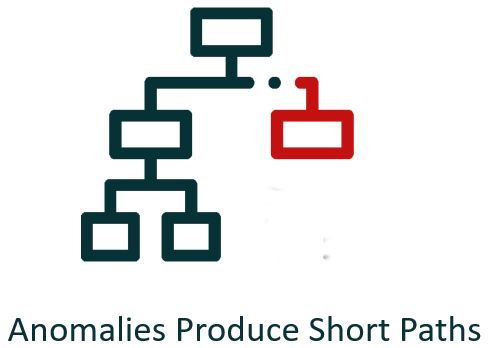
For the actual machine learning model, I decided to choose an isolation forest. The isolation forest algorithm is an unsupervised method for anomaly detection and is based on the principle that anomalies are rare and have characteristics that distinguish them from normal data points. The algorithm basically produces an ensemble of binary trees with anomalies resulting in short path lengths on the trees.
For every new data point that we want to predict, the model returns an anomaly score and a category. Thereby negative anomaly scores indicate an anomaly and positive anomaly scores predict a normal value. Given that the isolation forest is an eager learner with a very fast classification speed, it is ideal for the streaming data prediction of this project.
Training the Model
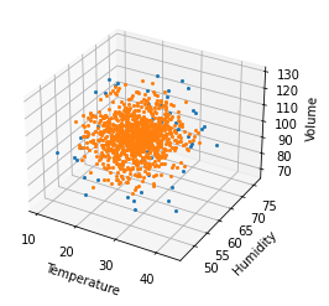
For this project, I used the implementation provided by the Scikit-learn library. It is important to note that the isolation forest needs a predefined level of expected anomalies. So all hyperparameters were left on their default values, except the expected anomaly percentage which was set to 5%. This value corresponds to the actual amount of flawed workpieces in the real production environment. Training the model and predicting the labels for the training dataset yielded the following graph with the blue points representing predicted anomalies.
The model was then serialized so that it could be used later on.
Web App Overview
The web application really consists of two distinct components which are packaged into two separate apps inside a Django project. First, we have the API which handles incoming data and returns predictions. And as the second component, there is the administration interface which allows for registering machines and examination of logged parts. Let’s start with a detailed view of the API.
Prediction API
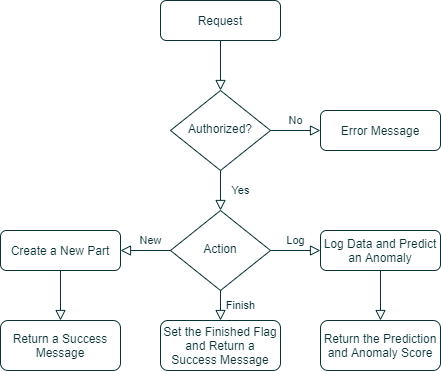
So, the endpoint of the API which handles incoming sensor readings is based on a Django-Rest-Framework API View. The endpoint’s functionality consists of four consecutive steps. First, we have a check if the request is from an authorized machine. If the received token and the machine’s description match a registered machine the next step is to create a new part.
After the creation, the logging of the sensor values and the predictions happens. Additionally, the prediction is returned in JSON format. The last step is to finish the part by making it available in the administration interface. All these individual steps are triggered by an additional value that is contained in the request of the machining script.
Administration Interface
To complement the API, the application features an administration interface. The interface allows for registering machines and viewing the logged parts. To use the interface, logging in to the admin account is required.
Machine Registration
To register machines, we must first navigate to the Machines page where we can enter a machine description into the registration form. The authentication token is then automatically generated by the application. After registration, the machine description and the token must be copied and inserted into the machining script. Of course, it is also possible to register more than one machine.
Part Inspection
The second part of the administration interface is the part overview which can be reached by entering the Parts page. Early in the development of the application, the decision was made to split the continuous sensor measurement into segments that correspond to the machining of a single part. So, in other words, each machine has three sensors with the sensor readings linked to a specific part. A part is thereby a random number of sensor values.
The anomaly score of the part is the cumulative score of all individual negative anomaly scores of the sensor readings. Additionally, parts have a start time and an end time. Additionally, the logged sensor values can be downloaded in CSV format.
Machine Simulation
The machine simulation is really a class that generates a random number of sensor readings and transmits them to the API via consecutive POST requests. To use the machining script, an instance of the machine class must be initiated. Here the registered machine name and token must be passed to the constructor of the class.
In the second step, the part machining can be simulated by calling the process method of the new machine instance and passing the new parts name as a parameter. After executing the script, a random number of sensor readings is generated. I decided to sort the sensor readings before sending them so that the anomalies are centered around a specific section of a part and not randomly placed inside the data. I did this by labeling the anomalies, sorting them, and then removing the labels before sending them. In theory, this would happen automatically in the real environment.
Demonstration
So now let’s look into the final part of the report which is a small demonstration of how to use the whole system.
Login
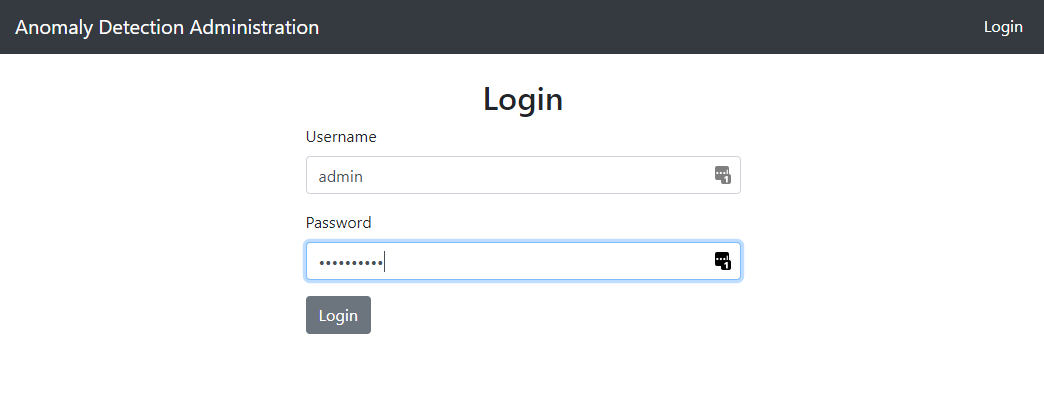
The first step is to log in and register a new machine. For this, we boot up the local Django server, enter the address of the application inside a browser and enter the credentials.
Machine Registration
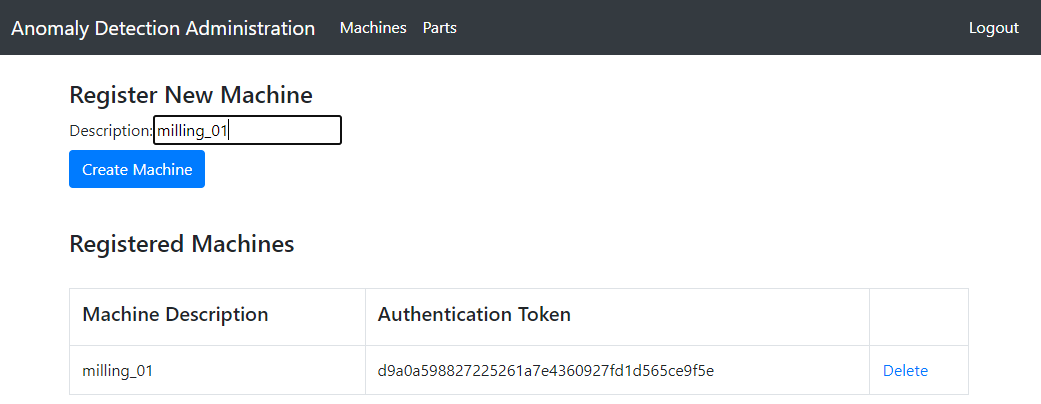
After successful login, we land on the homepage. Here are two smaller texts with instructions on how to use the application. We start by registering a new machine. For this, we click the Machines button which leads to the machines page. Here we type milling_01 into the registration form and click create machine. Now the new machine and the generated authentication token are displayed under the form.
Set Up the Simulation Script
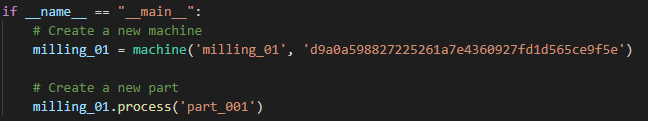
Before we can start simulating a part, the machining script must be modified. We initialize a new machine with the registered name, enter the authentication token, and call the process method of the machine with the part’s name as an argument.
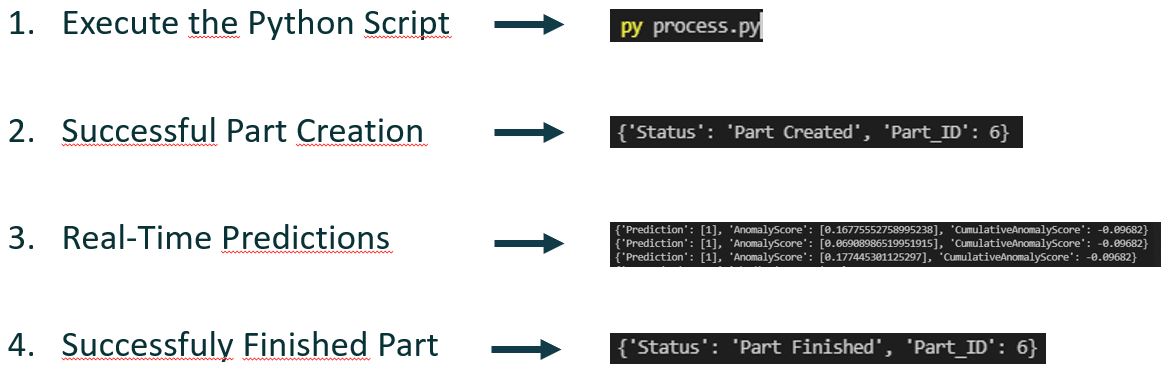
Simulating a Part
The data generation is then started by executing the Python script. The simulated part can take from one to 5 minutes. If everything worked correctly our first returned value is a confirmation that a new part has been created. Following are the real-time predictions of the sensor measurements and lastly a message that the part has been finished. It is important to note that the application supports multiple machines running simultaneously.
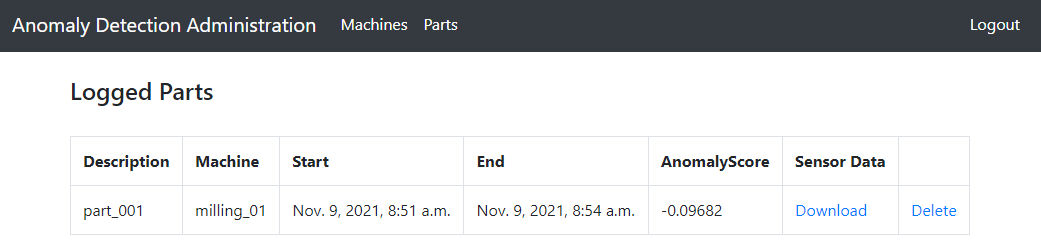
Part Inspection
A finished part can be inspected by clicking the Part button on the homepage. Here we have an overview of the most important parameters like the anomaly score and you can also download the sensor values or delete the part. In the production environment, the anomaly score would now be used to have an educated guess about the quality of a single part.
Conclusion
Moving forward, the system will be further refined and optimized based on the feedback and insights gained during the actual production with real sensor readings. Continuous monitoring, evaluation, and improvement will be essential to maximize the system’s performance and adaptability. As always the code and instructions on how to use the project are available on GitHub.
References
Liu, Fei Tony; Ting, Kai Ming; Zhou, Zhi Hua: Isolation Forest. In: Eighth IEEE International Conference on Data Mining 2008, S. 413 422.
Ul Islam, Raihan; Hossain, Mohammad Shahadat; Andersson, Karl (2018): A novel anomaly detection algorithm for sensor data under uncertainty. In: Soft Computing 22 (5), S. 1623 1639